
How to Review Consent Statistics and Cookie Reports
Captain Compliance reports on how visitors respond to your consent banner and on the cookies each scan finds. This article explains where to find each figure and what it tells you.
Overview dashboard
Select Overview in the sidebar for a summary of your account:
Consent outcomes: Allowed, Partially Allowed, Rejected, and No Activity, each with the change from the previous period
Total Users and Total Views
The number of Domains, Reports, Banners, and Pages in the account
Use Week, Month, or Year to change the period.
Banner status for a domain
Select Consent banner in the sidebar, and then select a domain. The Status section covers a rolling seven days, independent of the period chosen under Statistics.
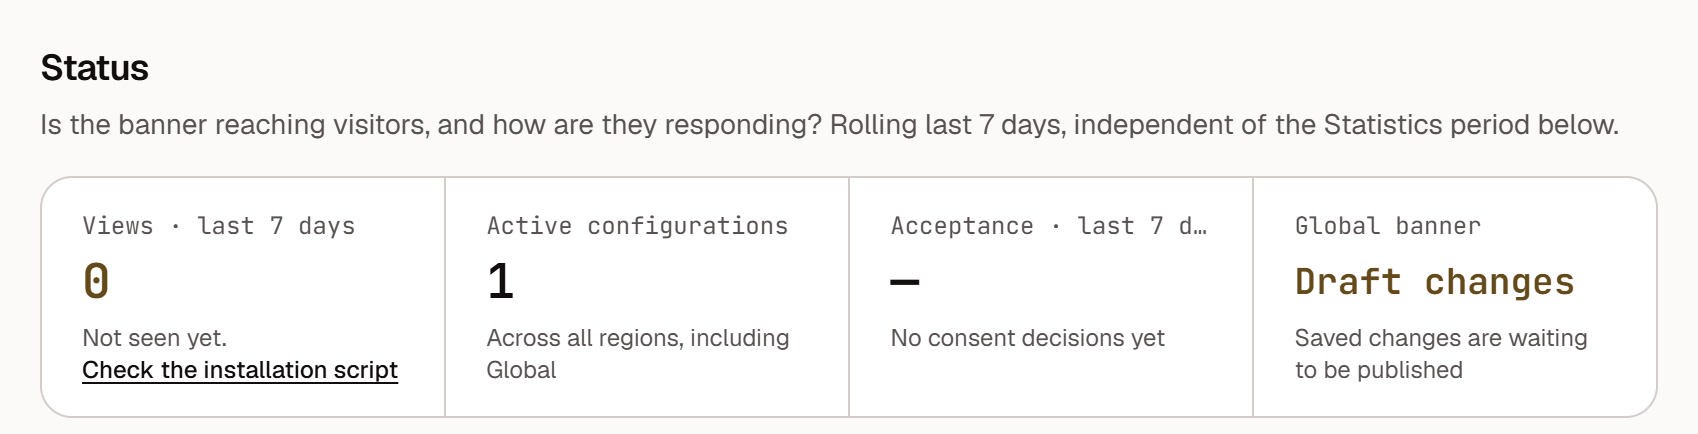
Figure | What it tells you |
|---|---|
Views | Whether the banner is reaching visitors. If it reads “Not seen yet”, check the installation script. |
Active configurations | The number of active banner configurations across all regions, including Global. |
Acceptance | How visitors are responding. It stays empty until there are consent decisions. |
Global banner | Whether the Global configuration is live. The published version is what visitors see. |
If Views stays at zero after you install the script, see How to Troubleshoot a Consent Banner That Does Not Appear or Respond.
Consent statistics
On the same page, the Statistics section shows views, visitors, and consent decisions for the calendar period you choose. Select Week, Month, or Year, or pick dates in the calendar.
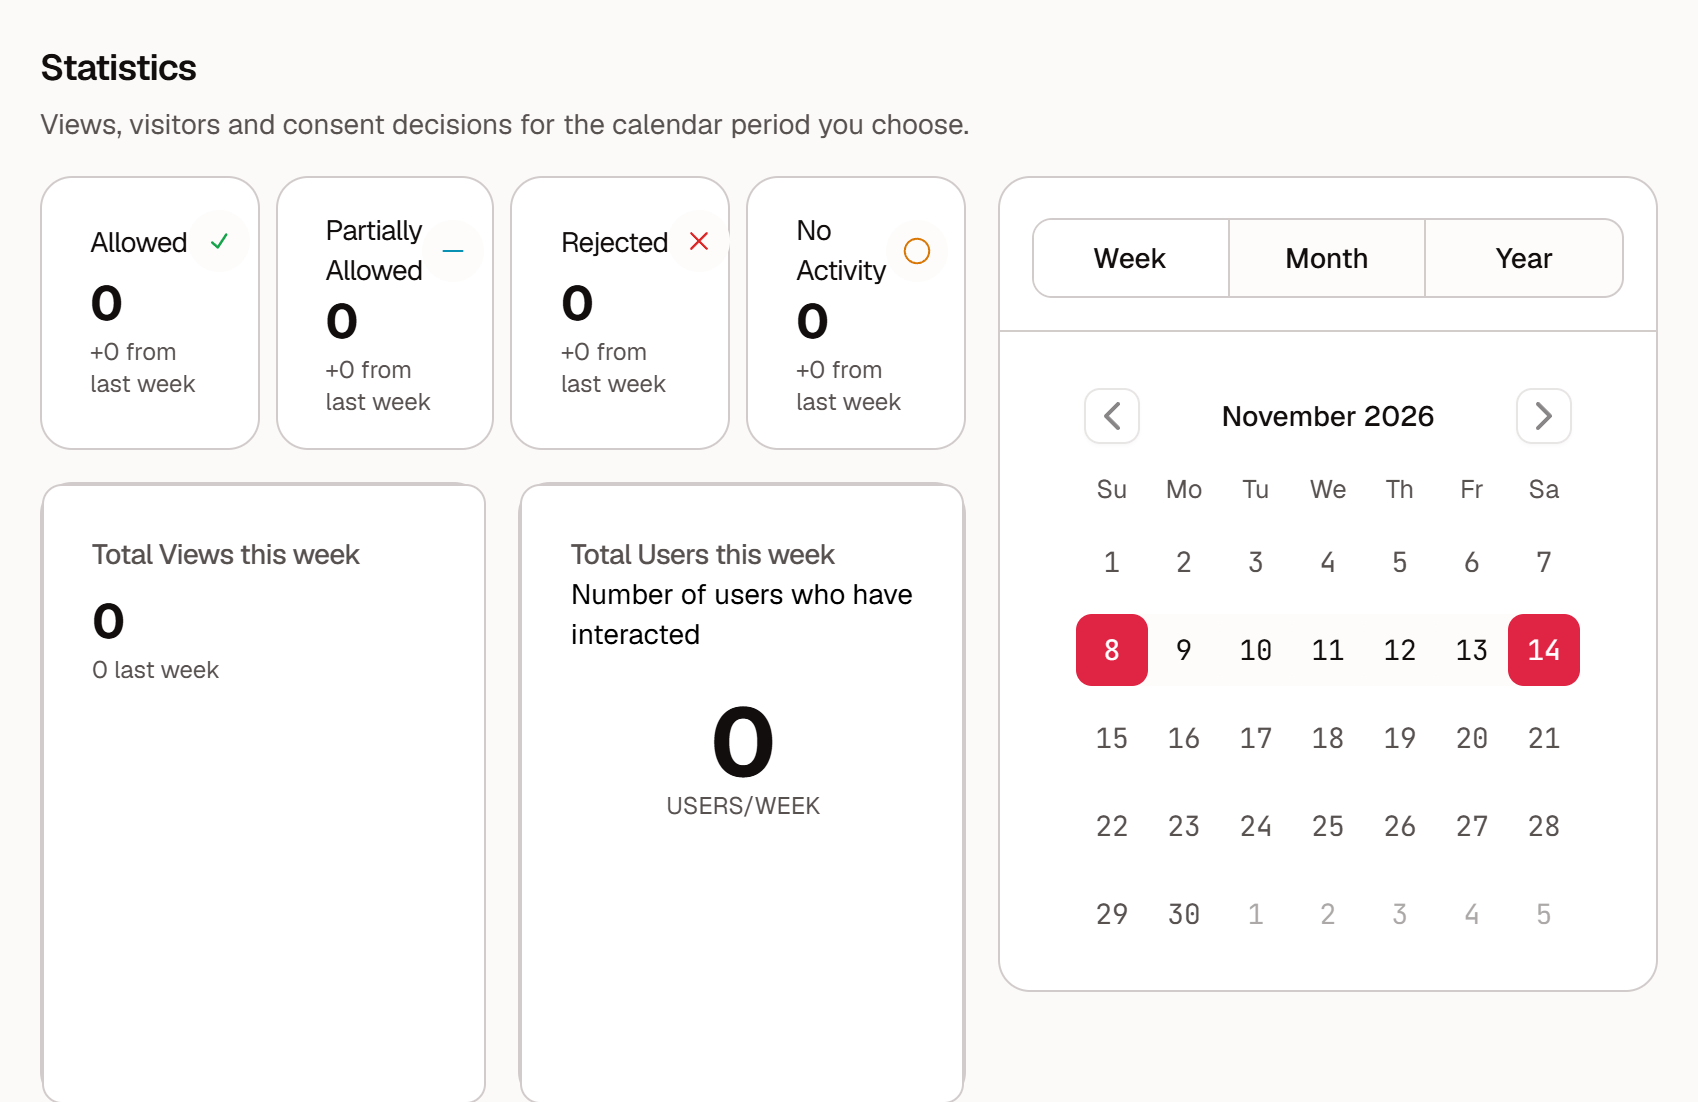
Figure | Meaning |
|---|---|
Allowed | Visitors who allowed every category |
Partially Allowed | Visitors who allowed some categories and not others |
Rejected | Visitors who rejected the non-essential categories |
No Activity | Visitors who saw the banner and made no choice |
Total Views | How many times the banner was shown |
Total Users | The number of users who interacted with the banner |
Cookie reports
Select Reports in the sidebar. The list shows one row per domain, with its first-party, third-party, and total cookie counts.
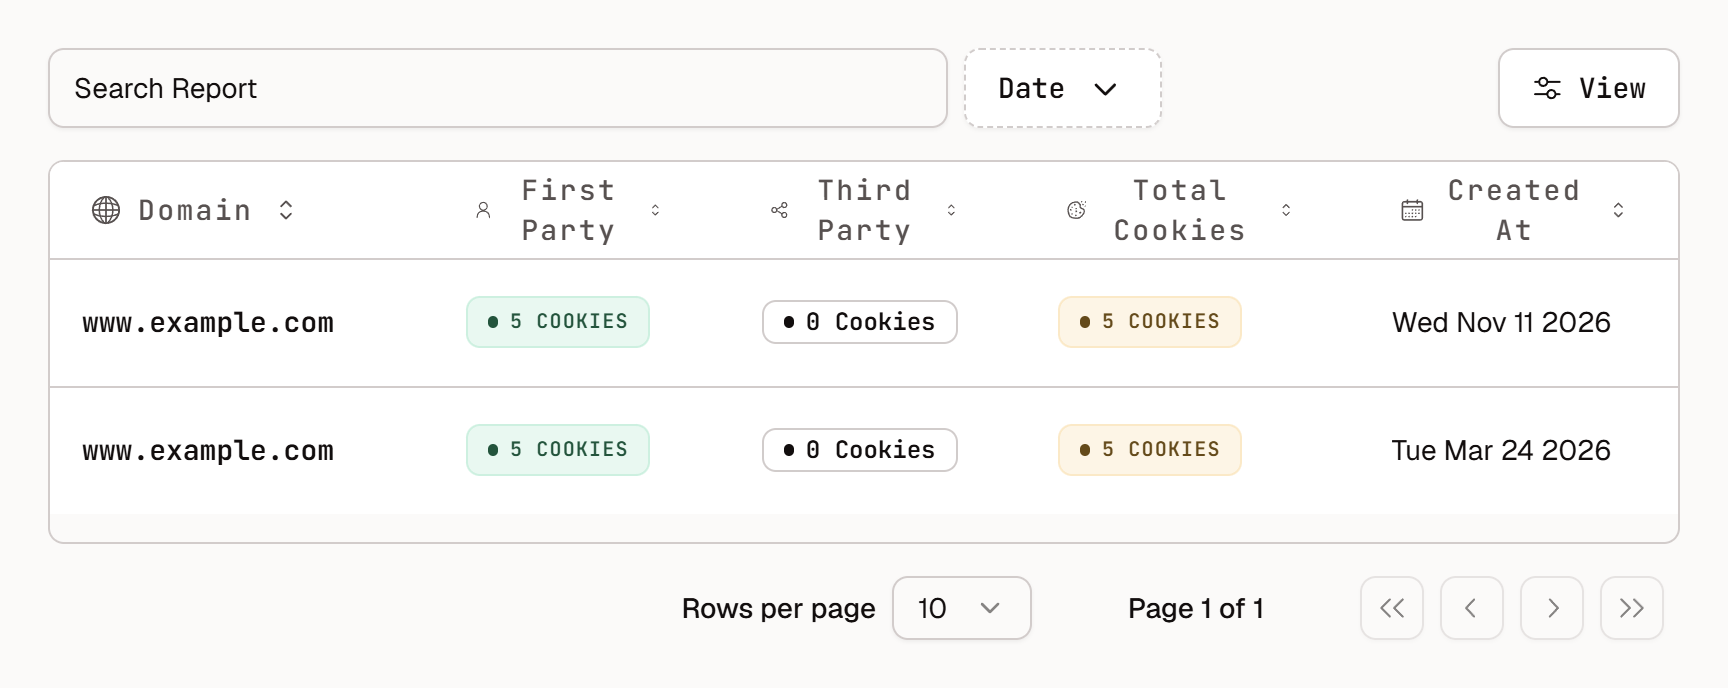
Select a domain to open its report. The report shows the date it was generated, a link to the domain’s transparency page, and every cookie grouped by party and category, with its Name, Value, Domain, Cookie type, Expiration, and Description.
Select Print Report to print the report or save it as a PDF from your browser’s print dialog.
Data subject request reports
Request volumes, completion, and overdue requests are reported separately under DSR Portal. See How to Process and Route Data Subject Requests.